This topic deals with the technological tools available to teachers that can be used to deliver information in their lessons that use multimodality and dual-coding: a combination of auditory and visual information. By combining visual stimuli such as infographics, animated images, videos, and other visual stimuli with read material, teachers can maximize the efficiency of information processing in their learners. Several different tech tools can be used in this pursuit!
One thing that I have struggled to understand is ‘vector graphics’ as compared to ‘pixel-based graphics.’ As Wikipedia states, “Vector graphics is a form of computer graphics in which visual images are created directly from geometric shapes defined on a Cartesian plane, such as points, lines, curves and polygons. The associated mechanisms may include vector display and printing hardware, vector data models and file formats, as well as the software based on these data models (especially graphic design software, computer-aided design, and geographic information systems). Vector graphics is an alternative to raster or bitmap graphics, with each having advantages and disadvantages in specific situations.[1]” (https://en.wikipedia.org/wiki/Vector_graphics)
As I understand it, Vector graphics uses coordinate-based data and formulae to create images that have greater resolution than pixel-based images. There are apparently advantages/disadvantages to both as well as times that are more appropriate to use vector vs pixel-based images for certain situations, but I don’t understand what those advantages/disadvantages are. I will need to spend time looking more in depth into those details.
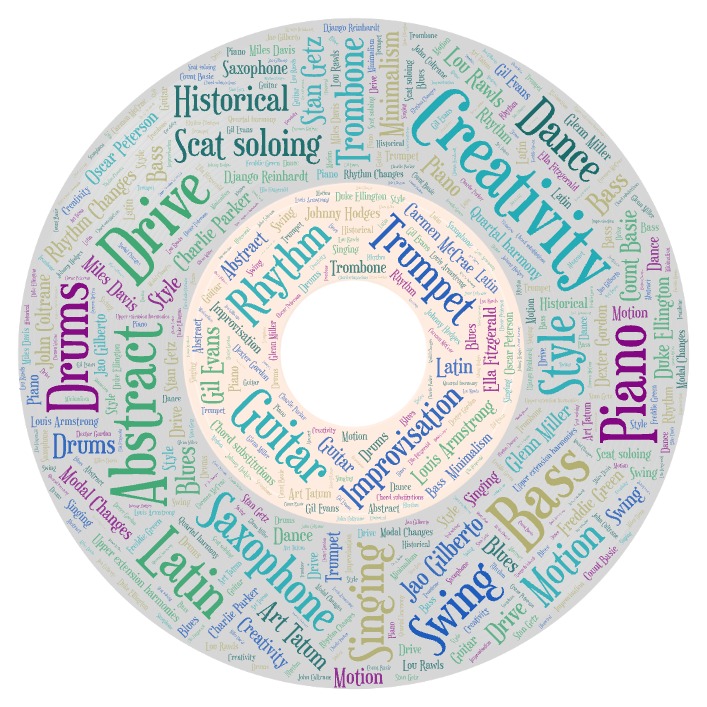
For the image below, I used wordart.com. I used this tool because of the easy accessibility (I was not required to create an account or pay a fee of any kind), and because of it’s intuitive, user-friendly mechanics. With little fooling around, I could jump right in and start creating an interesting word-based graphic – perfect for an old luddite such as myself!
Some of the tools that we reviewed were more aimed towards teachers’ use, and others towards learners’ use. Some of the tools that seemed best suited for teachers included Powerpoint, Figjam, and tools from Brian Mathers. Some tools that seemed equally accessible to both teachers and learners included Canva, Designer.microsoft, Pixlr, Vectr, and Comica. Some of the apps that seemed best suited to learners’ needs included Prisma, Mirror Lab, and 8 Bit Photo.
One way that I could envision using Designer.microsoft is to do a listening activity with students where I would play a piece of music, and ask them to use Designer.microsoft to write about what the music helps them to imagine. Then, using the tool, they can refine their descriptions to create an image that appropriately encapsulates their imaginative idea based on the music.